Your first Machine Learning project in Python with Step-By-Step instructions (Part 4 of 6)
After reading through a zillion articles and tutorials, now its time for you to build your first ever program in machine learning. If you are a machine learning enthusiast and looking to finally get started using Python, this tutorial is designed for you. The best way to learn machine learning is by building and understanding small projects end-to-end on your own.
Steps involved in a machine learning project:
Following are the steps involved in creating a well-defined ML project:
- Understand and define the problem
- Analyse and prepare the data
- Apply the algorithms
- Reduce the errors
- Predict the result
Our First Project : Lets predict the salary of a data scientist based on his working experience in years
The best way to learn a new platform or tool is to work on a machine learning project end-to-end and cover the key steps. from loading data, cleansing data, summarizing data, evaluating algorithms and finally making some predictions.
We are going to use a simple training data set:
Based on the number of years of experience, we are going to predict the salary
| Years of experience | Salary($) |
| 1 | 110,000 |
| 2 | 120,000 |
| 3 | 130,000 |
| 4 | 140,000 |
| 5 | 150,000 |
| 6 | 160,000 |
| 7 | 170,000 |
| 8 | 180,000 |
| 9 | 190,000 |
| 10 | 200,000 |
Why this is a good problem for beginners to solve:
- This is a simple one-variable problem (Uni-variate linear regression) where we predict the salary in USD ($)
- Attributes are numeric so you have to figure out how to load and handle data and moreover no data cleansing or transformations are required
- The data set has only has only 2 attributes and 10 rows, meaning it is small and easily fits into memory and easy to interpret.
So, Take your time to understand the problem statement. Work through each step.
You can simply click on the commands to copy the commands and paste into your program
Load the salaries data set
- Launch Anaconda navigator and open the terminal
- Type the below command to start the python environment
python
- Lets make sure the python environment is up and running. Copy paste the below command in the terminal to check if its working properly
print("Hello World")
- Well and good, lets start writing our first program. First its important that we import all the required libraries for our project. So copy-paste the below commands into the terminal. (You can copy all of them at once)
import pandas
import numpy as np
import matplotlib.pyplot as plt
from sklearn.metrics import accuracy_score
- Now lets load the salary training data set and assign it to a variable called "dataset"
#Load training dataset
url = "https://raw.githubusercontent.com/callxpert/datasets/master/data-scientist-salaries.cc"
names = ['Years-experience', 'Salary']
dataset = pandas.read_csv(url, names=names)
Summarize the data and perform analysis
Lets take a peek into our training data set:
- Dimensions of data set: Find out how many rows and columns our dataset has using the shape property
# shape
print(dataset.shape)
Result: (10,2), Which means our dataset has 10 rows and 2 columns
- To see the first 10 rows of our dataset
print(dataset.head(10))
Result:
   Years-experience  Salary
0                 1  110000
1                 2  120000
2                 3  130000
3                 4  140000
4                 5  150000
5                 6  160000
6                 7  170000
7                 8  180000
8                 9  190000
9                10  200000
- Find out the statistical summary of the data including the count, mean, the min and max values as well as some percentiles.
print(dataset.describe())
Result:
       Years-experience         Salary
count          10.00000      10.000000
mean            5.50000  155000.000000
std             3.02765   30276.503541
min             1.00000  110000.000000
25%             3.25000  132500.000000
50%             5.50000  155000.000000
75%             7.75000  177500.000000
max            10.00000  200000.000000
Visualize the data and perform analysis
Now that we have loaded the libraries ,imported the data set and done some numbers crunching. its time for us to look at the data and understand it.
- Lets take a look at the dataset using a plot graph. Copy paste the below commands to plot a graph on our dataset
#visualize
dataset.plot()
plt.show()
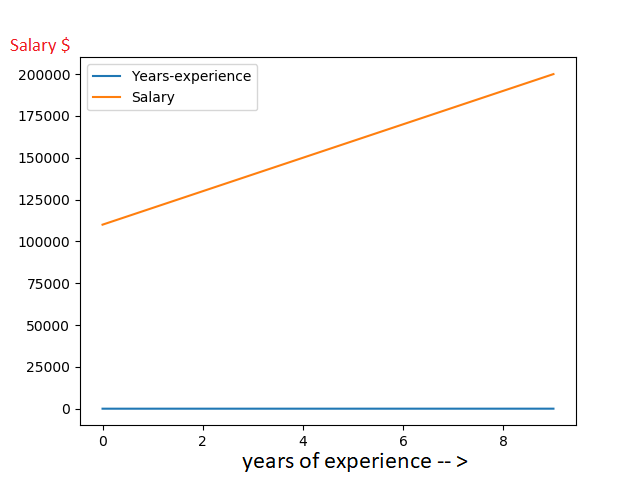
As in the diagram, we have two parameters. Years of experience and Salary. with the Orange line is the correlation between the two
Splitting the Data
In Machine learning we have two kinds of datasets
- Training dataset - used to train our model
- Testing dataset - used to test if our model is making accurate predictions
Since our dataset is small (10 records) we will use 9 records for training the model and 1 record to evaluate the model. copy paste the below commands to prepare our datasets.
X = dataset[['Years-experience']]
y = dataset['Salary']
from sklearn.model_selection import train_test_split
X_train, X_test, y_train, y_test = train_test_split(X, y, test_size=0.1, random_state=101)
Training the Model
Now that we have analysed the data and have our training and testing sets ready. We will use the below commands to train our model. For this example we are choosing linear regression as we are trying to predict a continuous number (Salary)
from sklearn.linear_model import LinearRegression
model = LinearRegression()
model.fit(X_train,y_train)
Testing the Model
We have our trained model and now we should start using it for predictions. Let us use our testing dataset that we have to estimate the accuracy of our model
predictions = model.predict(X_test)
print(accuracy_score(y_test,predictions))
We are getting 1.0 which is 100% accuracy for our model. Which is the ideal accuracy score. In Production systems, anything over a 90% is considered a successful model
We can also test our model with our own input
Lets try how much money does a person with 6.3 years of experience can make
print(model.predict(6.3))
Result: [163000.]. Our model is estimating 163k for a person with 6.3 years of experience.
Congratulations on completing your first machine learning project. Now take a break, hit that trail for a jog or treat yourself with that Netflix show that you have been longing for
Summary
To Summarize, In this tutorial, you discovered step-by-step on how to import, analyze, and predict using your first machine learning project in Python
Your Next Steps
Go through this tutorial again to revise your understanding. List our your queries and research them online. Comment if you have any feedback or questions. Sign up for a free account in this community if you haven't already
Next step: Your second practice project in machine learning with python
How did this project come up ? Share your thought in the comments. And share your knowledge with others in the copycoding community
nVector
posted on 04 Sep 18Enjoy great content like this and a lot more !
Signup for a free account to write a post / comment / upvote posts. Its simple and takes less than 5 seconds
Post Comment